System health and monitoring
Makalu provides a built-in health monitoring system that gives operators a status overview of its system/backend components.
The health monitoring system consists of two complementary views:
- The System Overview in the Makalu Hub provides an overview of all deployed components, including third-party systems and infrastructure services.
- The Health tab in the Makalu Automation Detailed Channel View focuses exclusively on Makalu's own APIs and services, and provides the starting point for targeted troubleshooting and service control.
System Overview (Hub)
The System Overview is located on the right side of the Makalu Hub and provides a consolidated view of the operational status of all components that make up the Makalu deployment. This includes Makalu's own components as well as connected third-party systems.
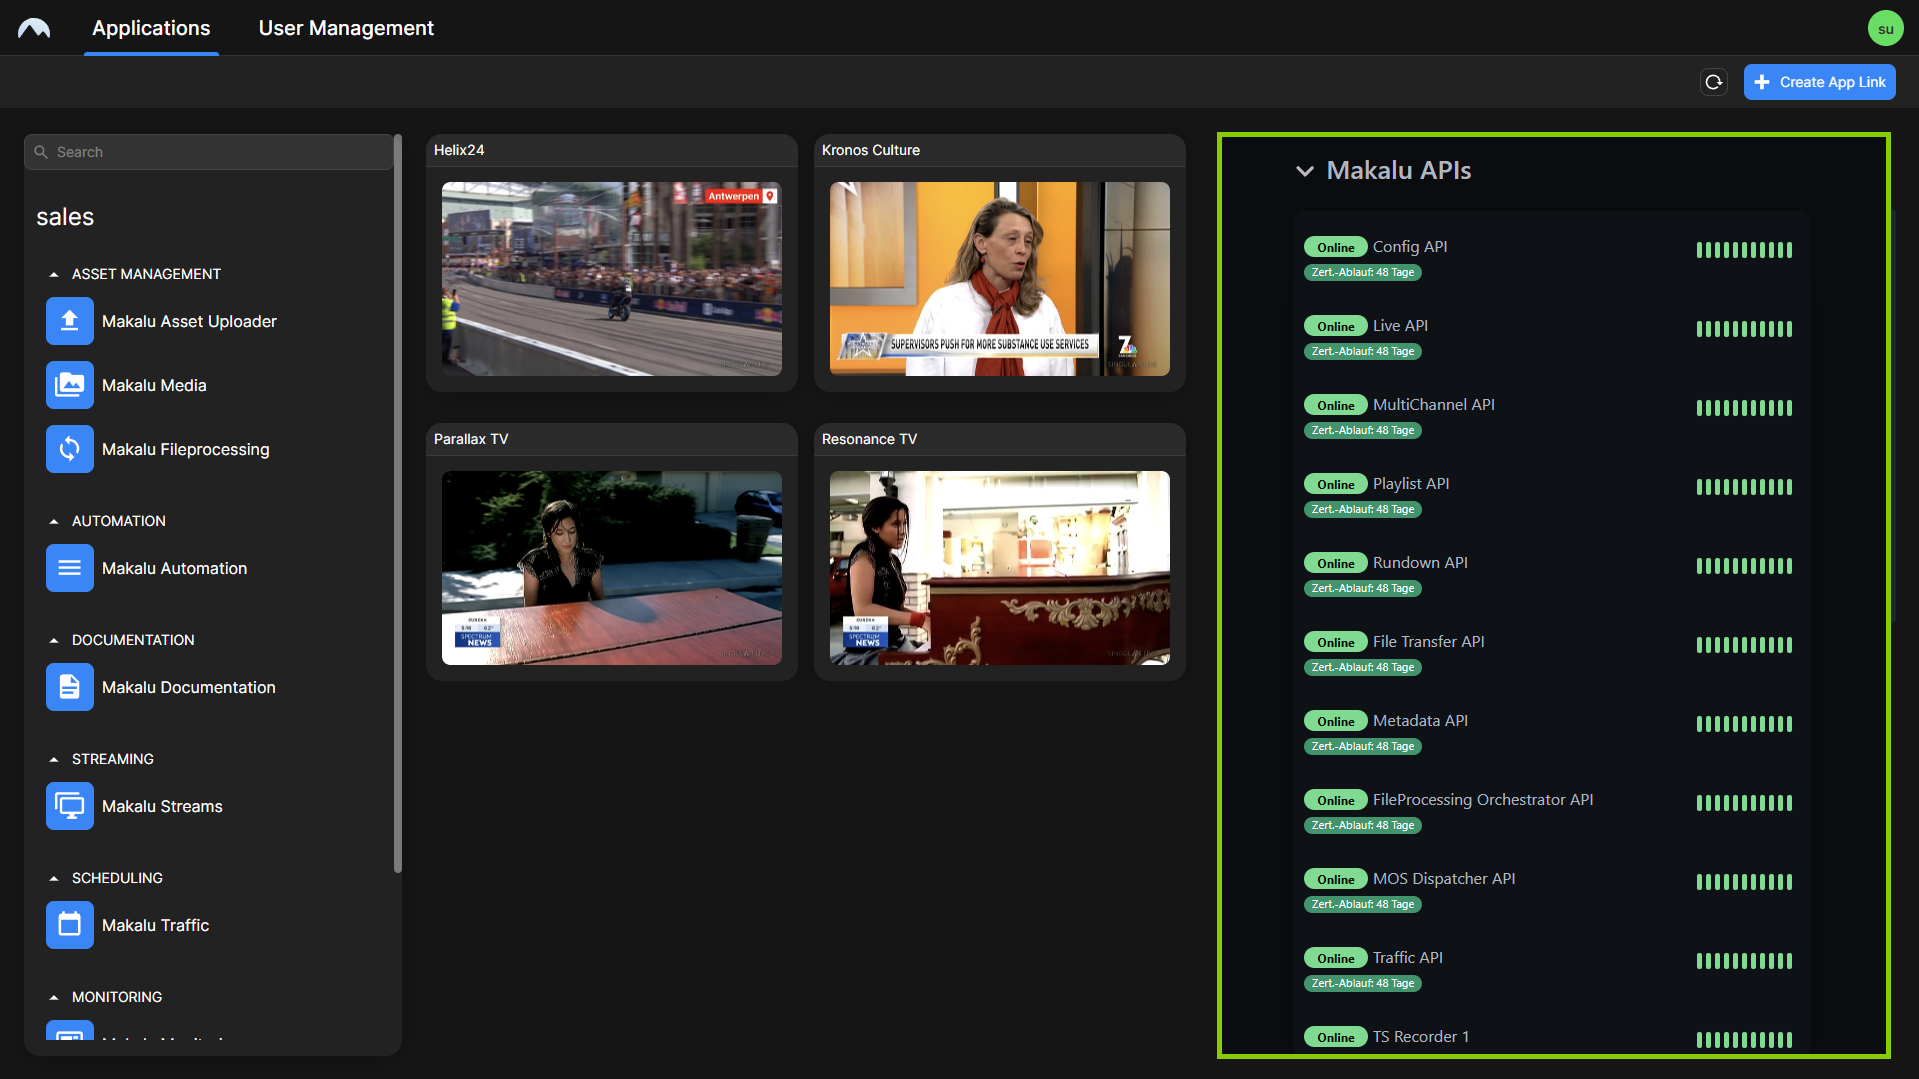
The overview displays each monitored component with its current availability status and, where applicable, the remaining validity period of its SSL/TLS certificate. The displayed percentage indicates the availability over the past 24 hours. A brief status history allows operators to identify recent issues that may no longer be active.
Notice
The language used in the overview (for example, labels and time formats) follows the language settings of the user's browser.
Health tab (Detailed Channel View)
The Health tab is part of the Makalu Automation Detailed Channel View and provides a detailed status overview of all Makalu APIs deployed in the current environment.
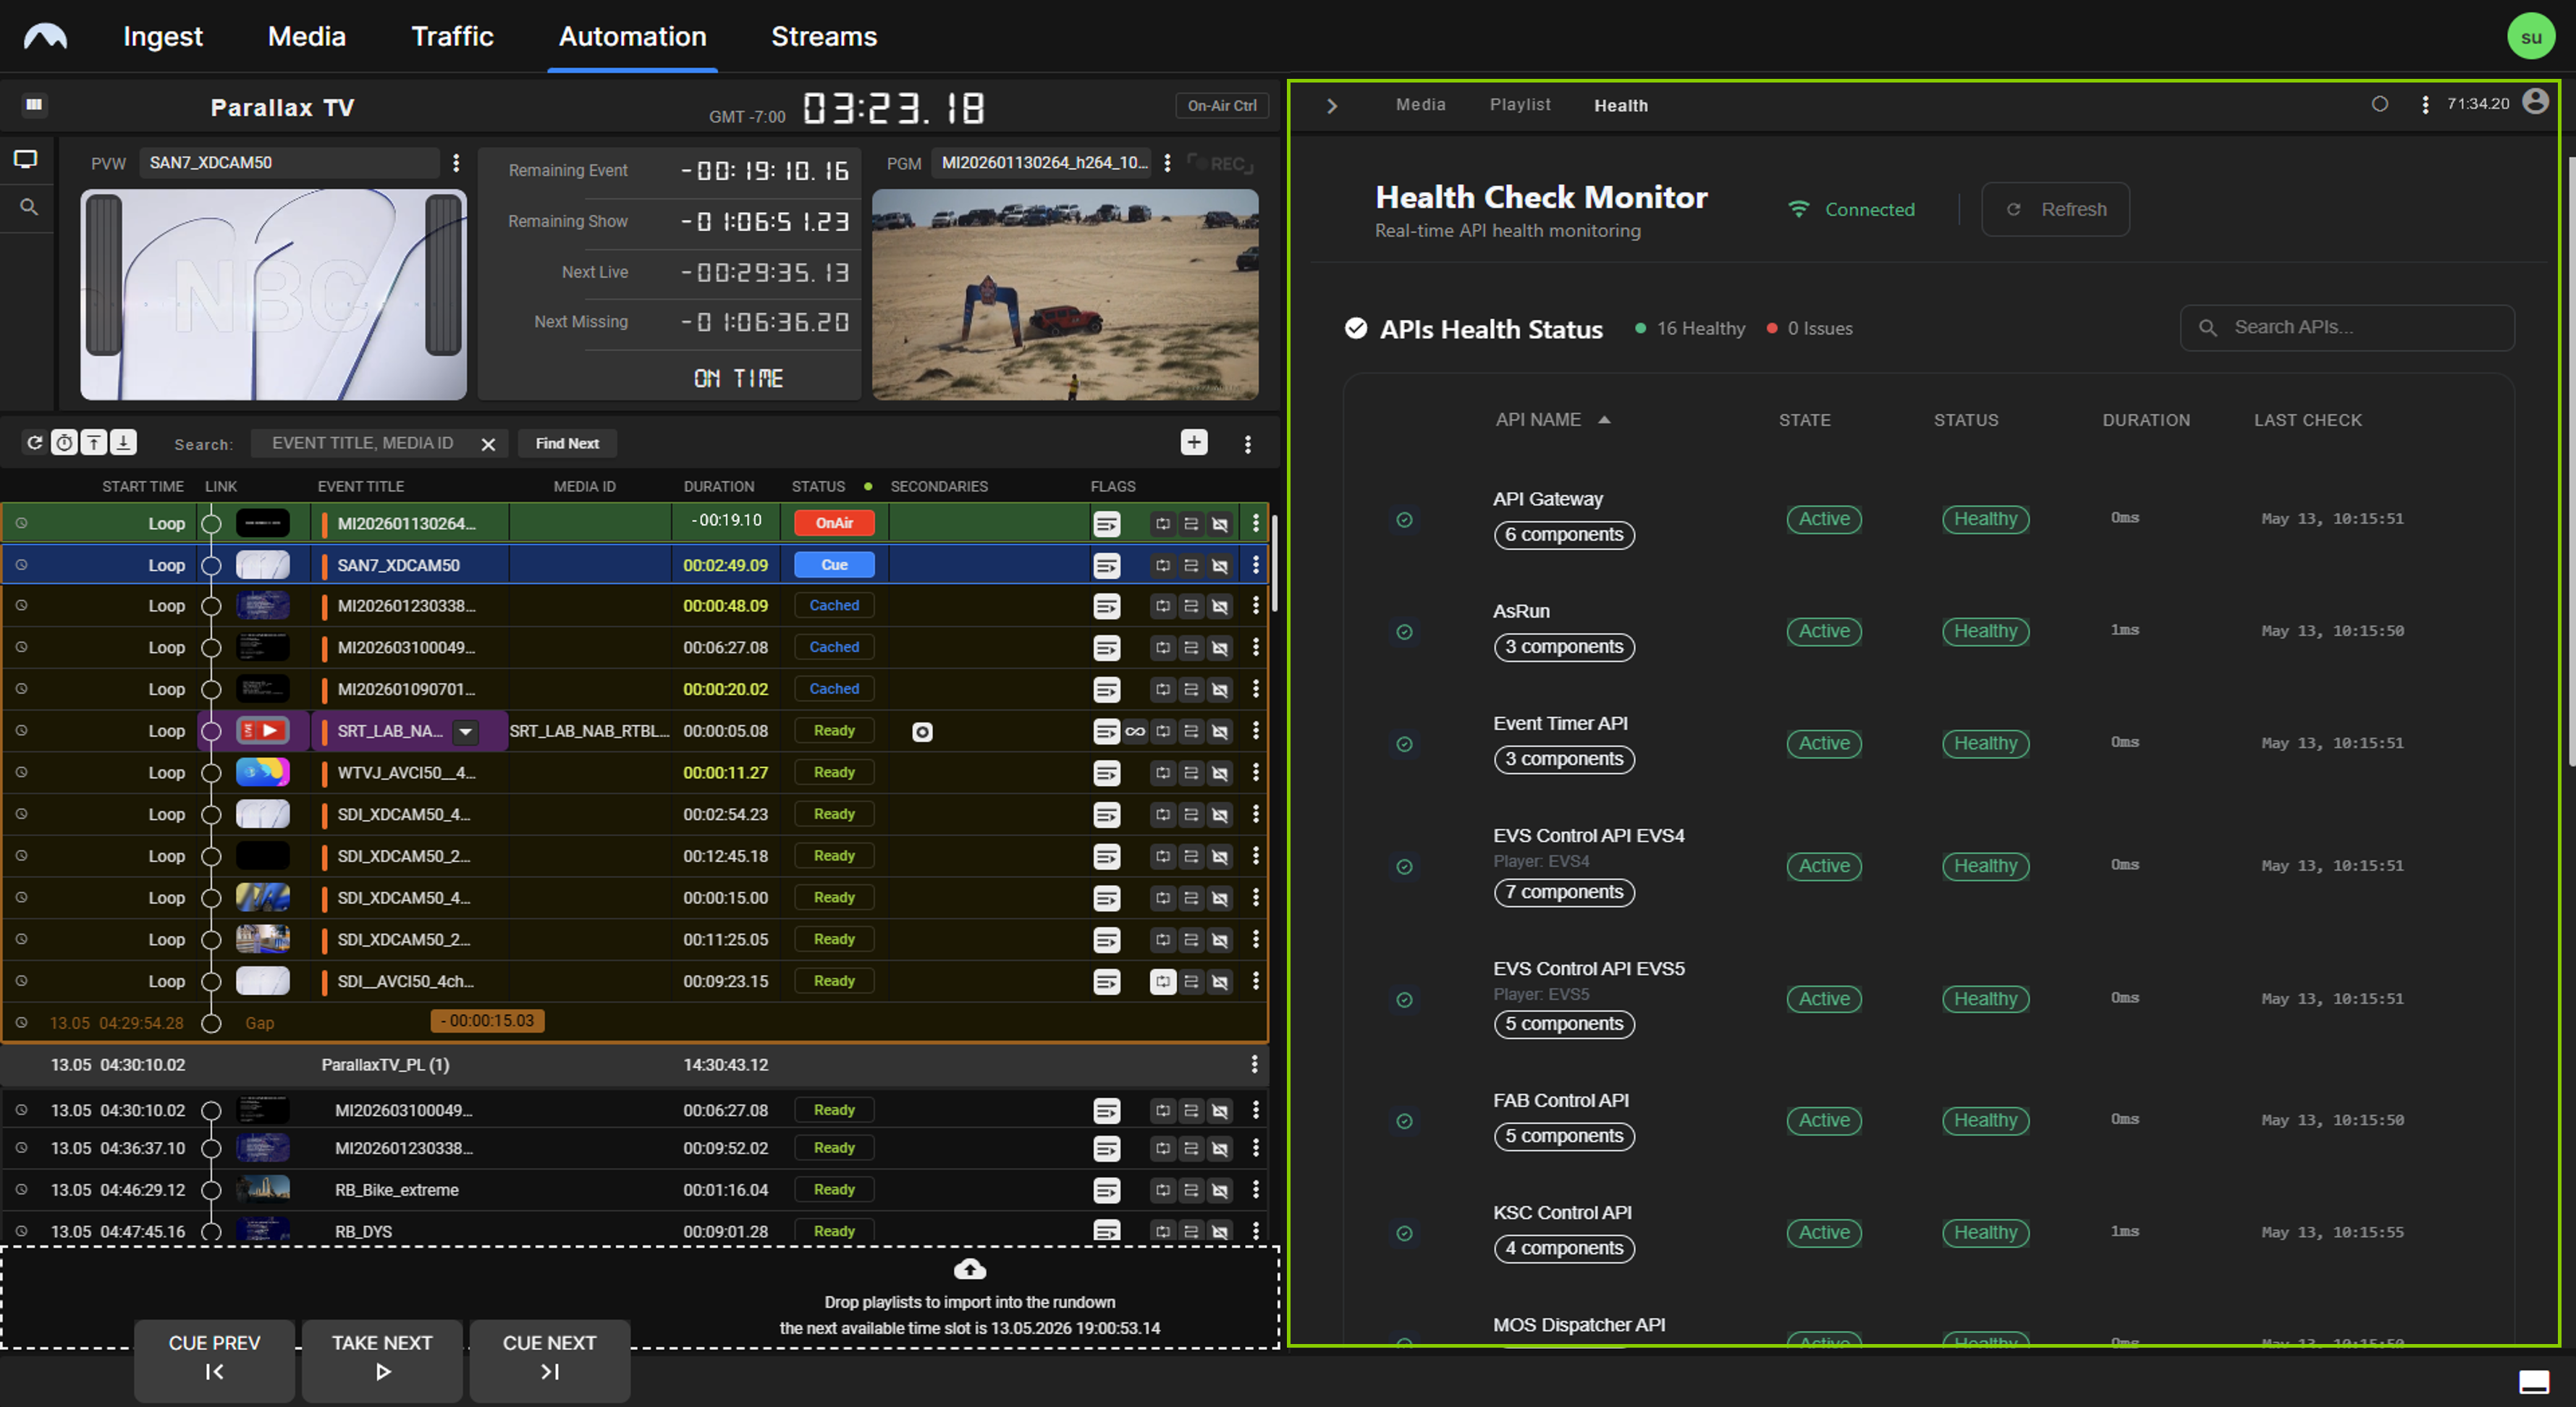
If one or more components report an issue, a red warning indicator is displayed next to the tab label, alerting operators without requiring the tab to be open.
Notice
The Health tab replaces the legacy status dropdown previously available in the Makalu Automation Detailed Channel View.
API overview
The Health tab displays a list of all deployed Makalu APIs. Each entry includes the following information:
| Column | Description |
|---|---|
| API name | The name of the API or service and the number of checked components |
| Activity status | Indicates whether the component is currently active or in passive/standby mode |
| Health status | Current health status: Healthy or Unhealthy |
| Duration | Time required to retrieve the last health update |
| Last check | Timestamp of the most recent status check |
By default, the status information is updated every 10 seconds. A component is marked as Unhealthy if no status update can be retrieved during a check or when the component itself reports that it is unhealthy.
Above the list the total number of components currently healthy and unhealthy is displayed. In addition, a search field allows you to filter the list by component name.
API detail view
Selecting an entry from the API list opens a detail view for that component.
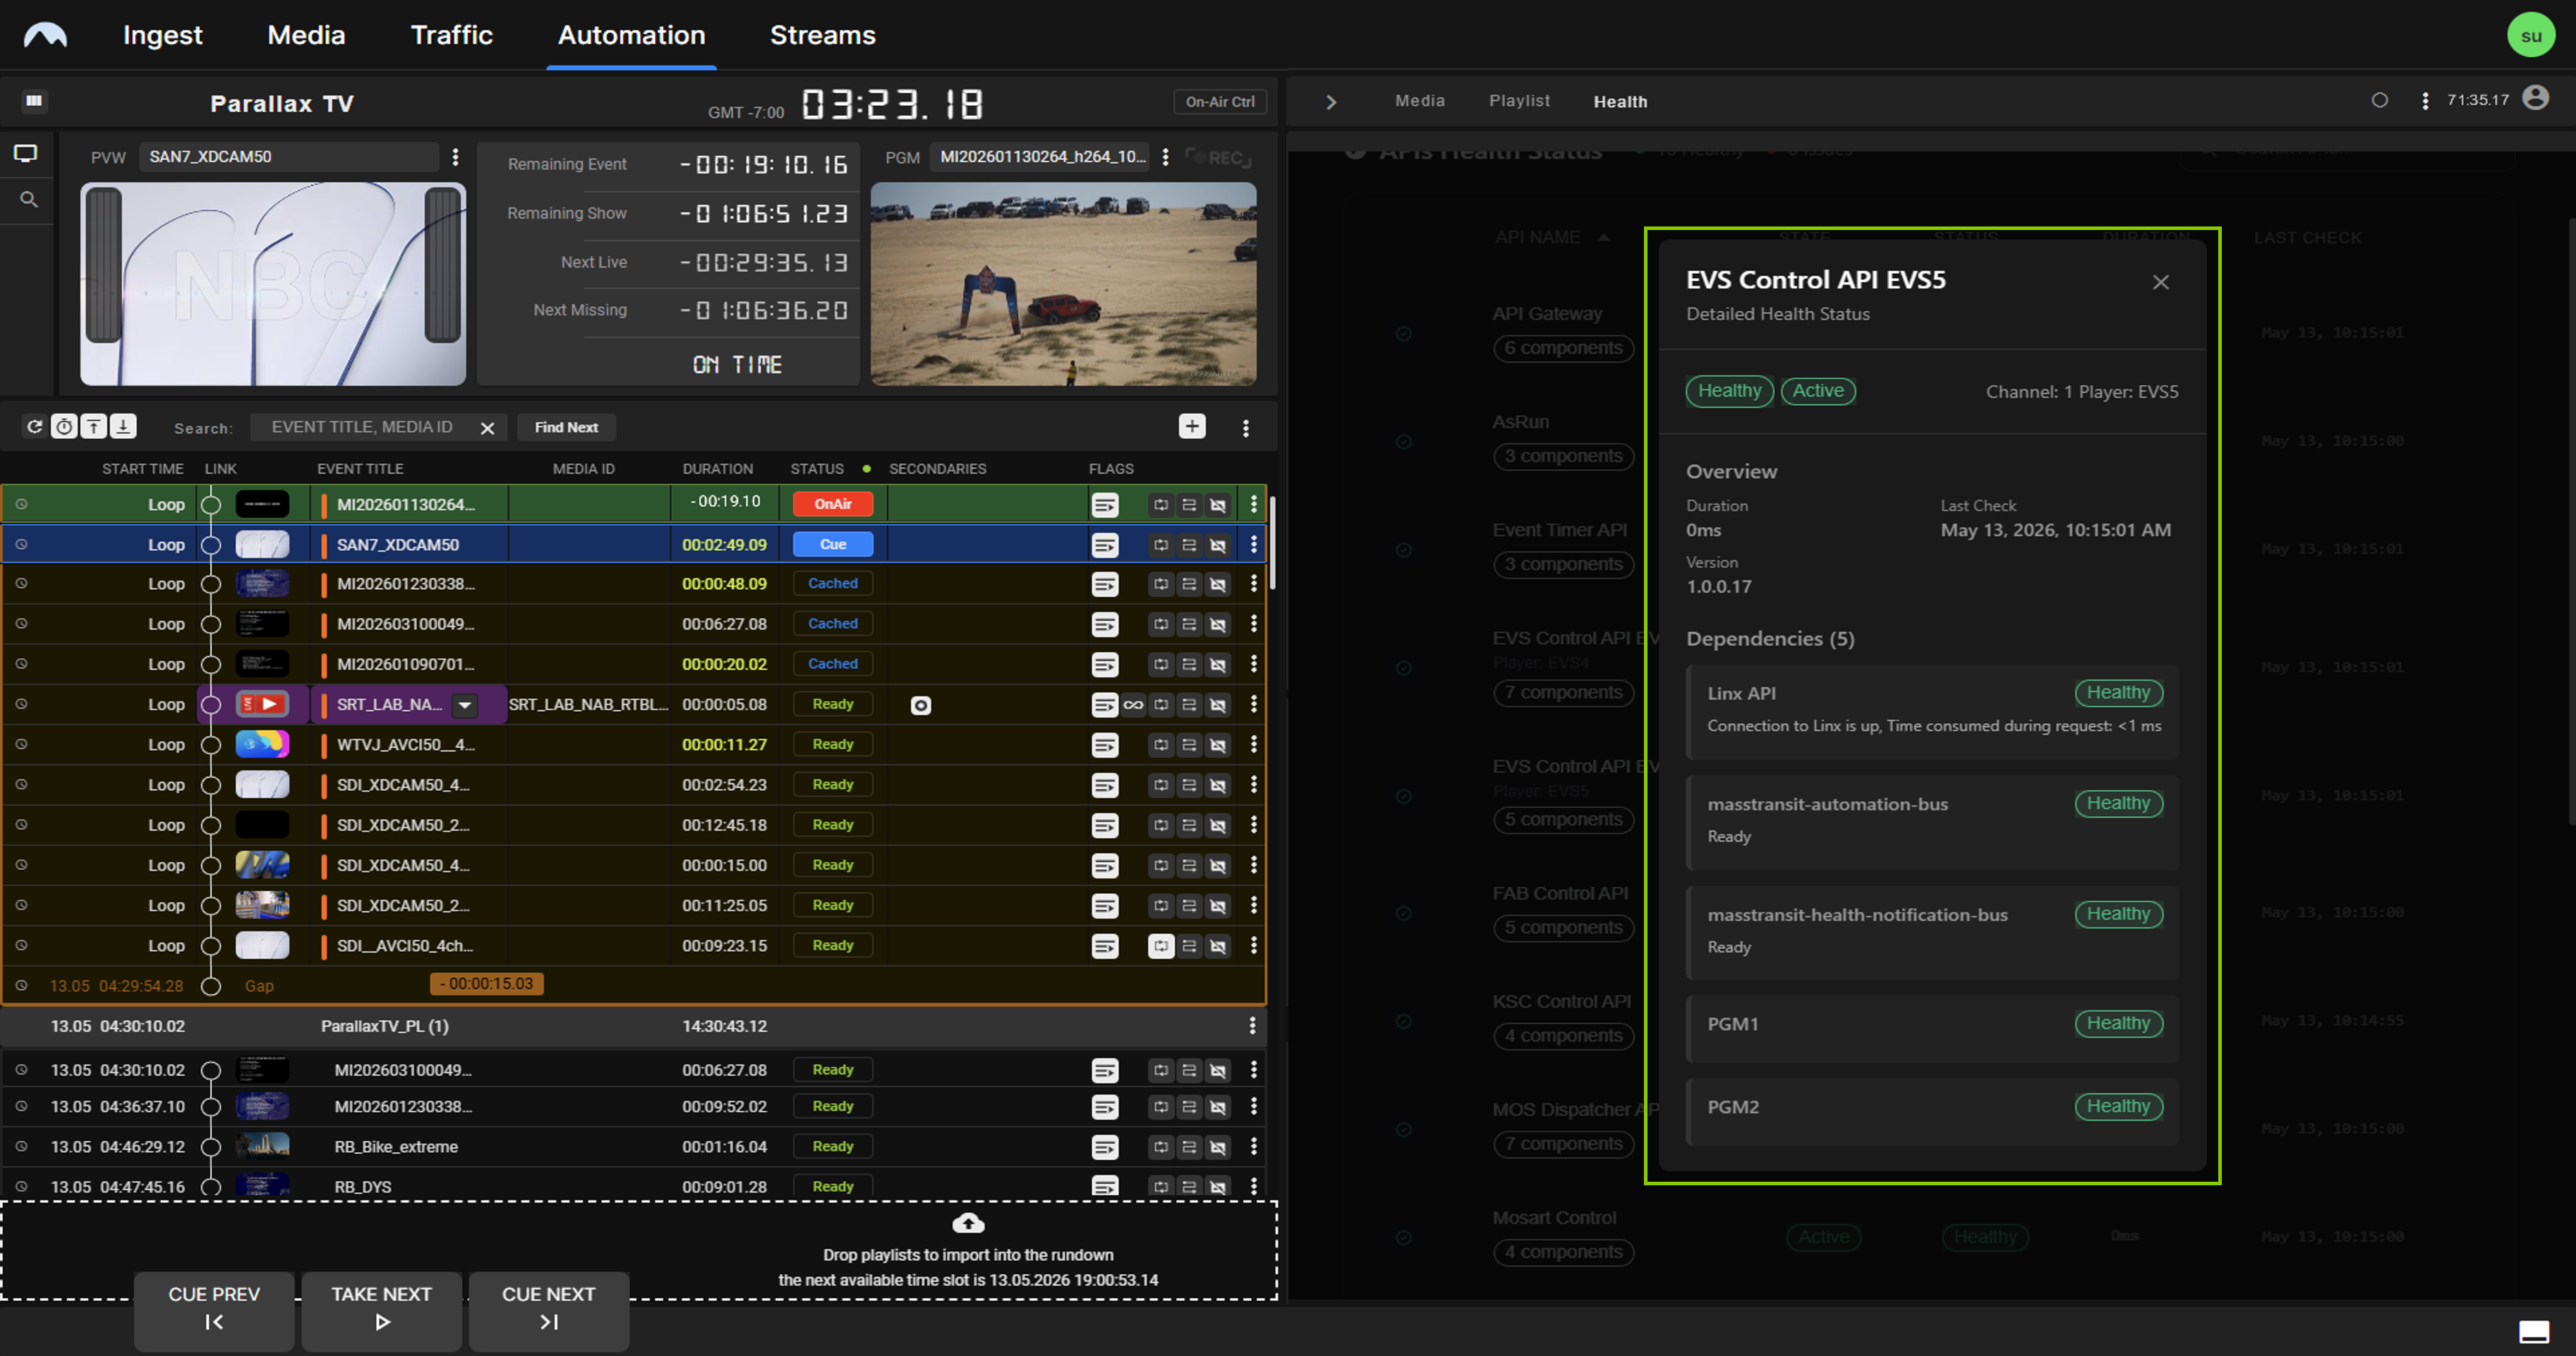
The detail view provides:
- The aggregated activity and health status of the component
- The deployed version of the component
- A breakdown of the status of the dependencies that contribute to the overall status of the component
- The timestamp of the last check for each individual sub-component
If a dependency (such as a connected device or an external system) is unavailable, this is reflected in the detail view and contributes to an Unhealthy status for the parent component.
Service Control tab (Detailed Channel View)
The Service Control tab allows authorized users to restart, start, or stop individual Makalu services directly from the Makalu Automation Detailed Channel View. It is intended for use when a service has been identified as unhealthy via the Health tab and a restart is required to restore normal operation.
Warning
Starting, stopping, or restarting a service may temporarily affect the functionality of Makalu during the operation. Service Control should only be used by trained operators with the appropriate system knowledge and user permissions.
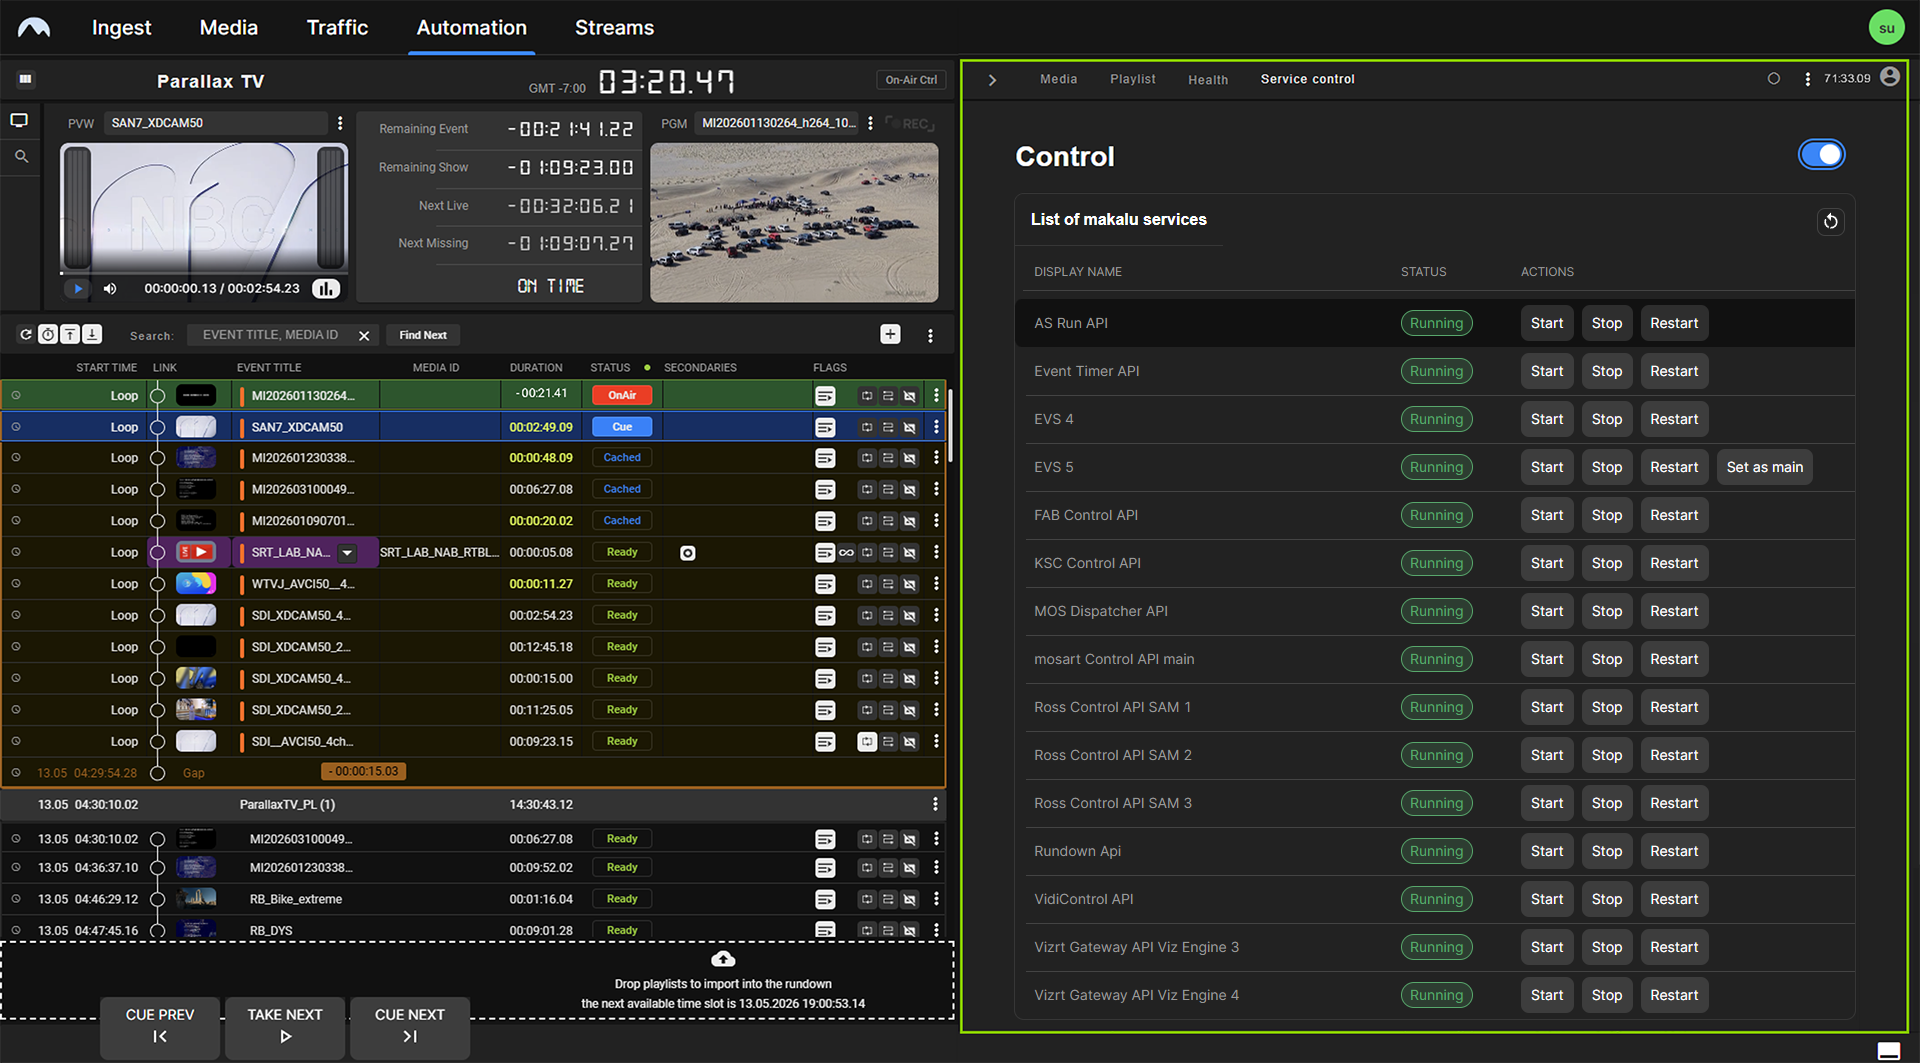
Accessing Service Control
The Service Control tab is only available to users with the required roles and permissions. It is not permanently visible. To open it:
-
Open the Options menu
 at the top right of the Makalu Automation Detailed Channel View and select Display Service Control.
The Service Control tab is displayed.
-
Select the Service Control tab.
The States overview is displayed.
-
Enable the toggle switch at the top right.
The Control overview is displayed.
Restarting a service
The Service Control tab lists all Makalu services available in the current deployment. Each entry displays the current state of the service (for example, Running, Stopped, or Error).
To restart a service:
- Locate the service in the list.
- Click Restart to restart the service, or use Start / Stop to change its state.
- In the confirmation dialog click OK to confirm your action.
The selected service is restarted.